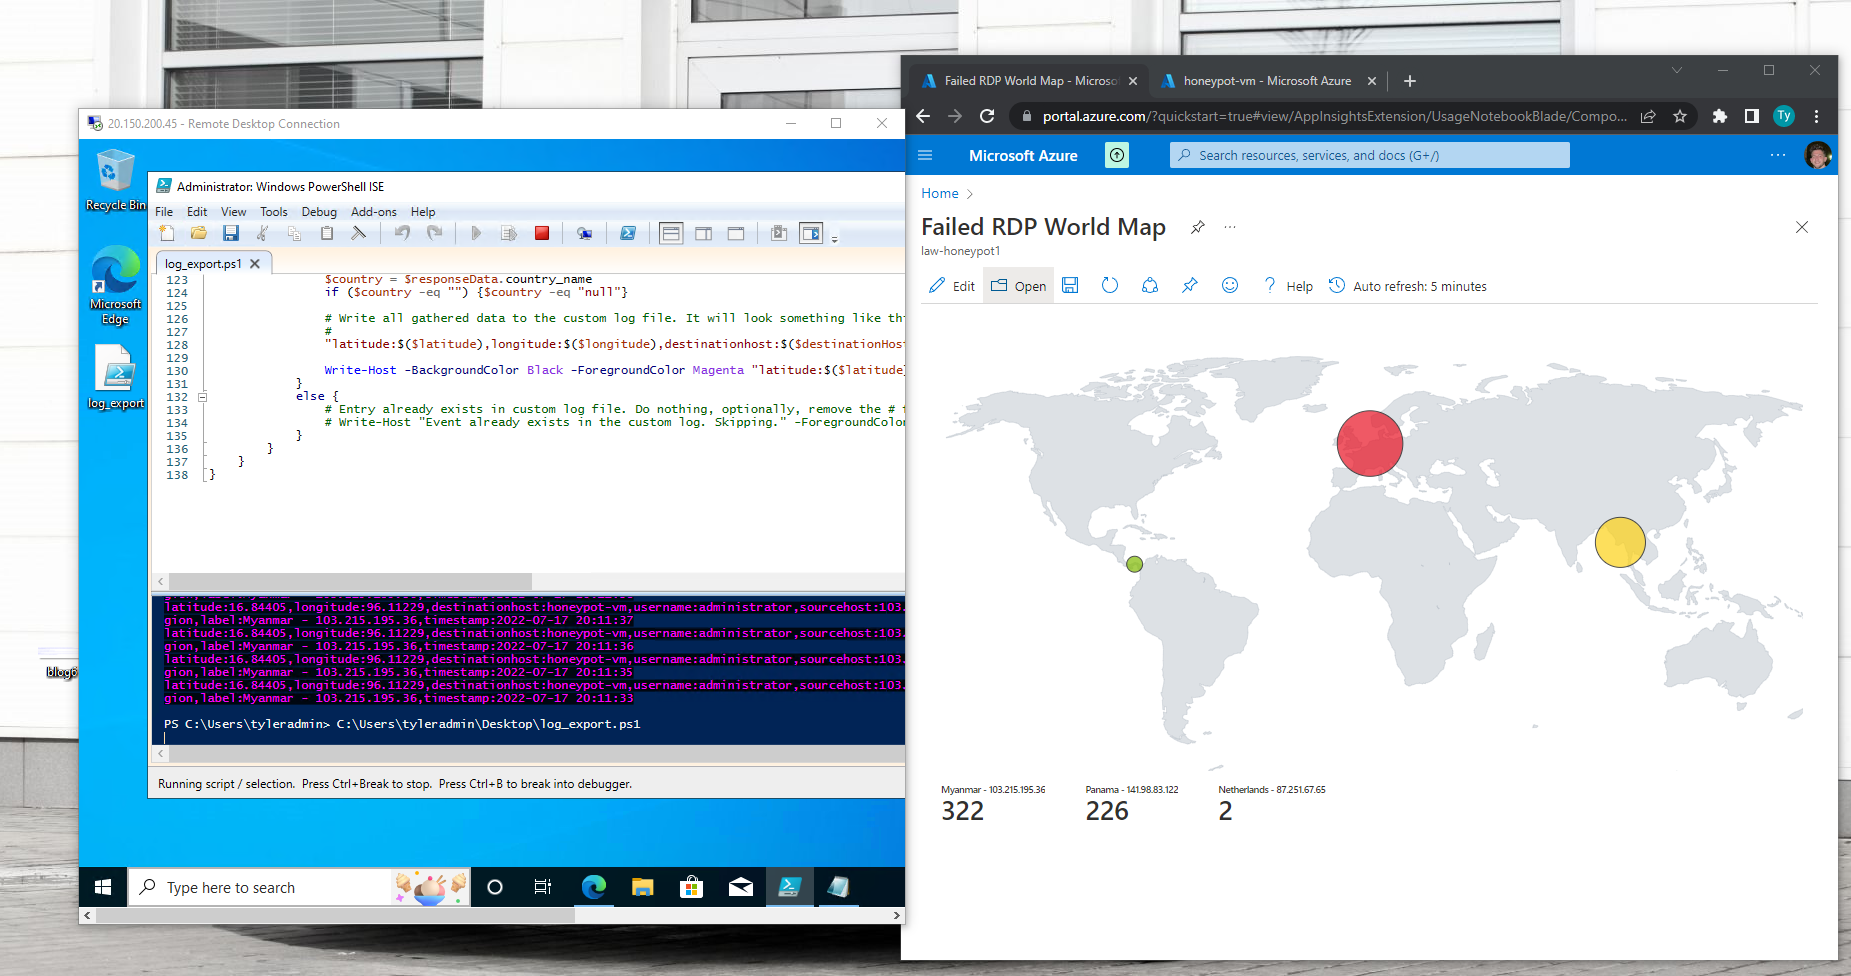
Using Microsoft Azure free trial I created a virtual machine with the firewall off making it able to be pinged from any country. I also created a network security group within Azure to open all the ports to make the virtual machine easily discoverable.


Next I created a log repository in Azure which is called Log Analytics Workspace that ingested logs from the exposed virtual machine.
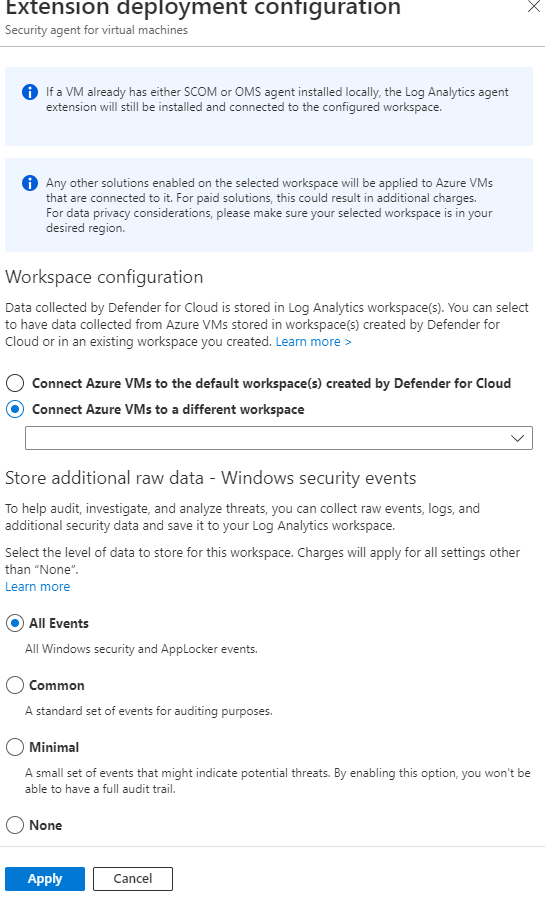
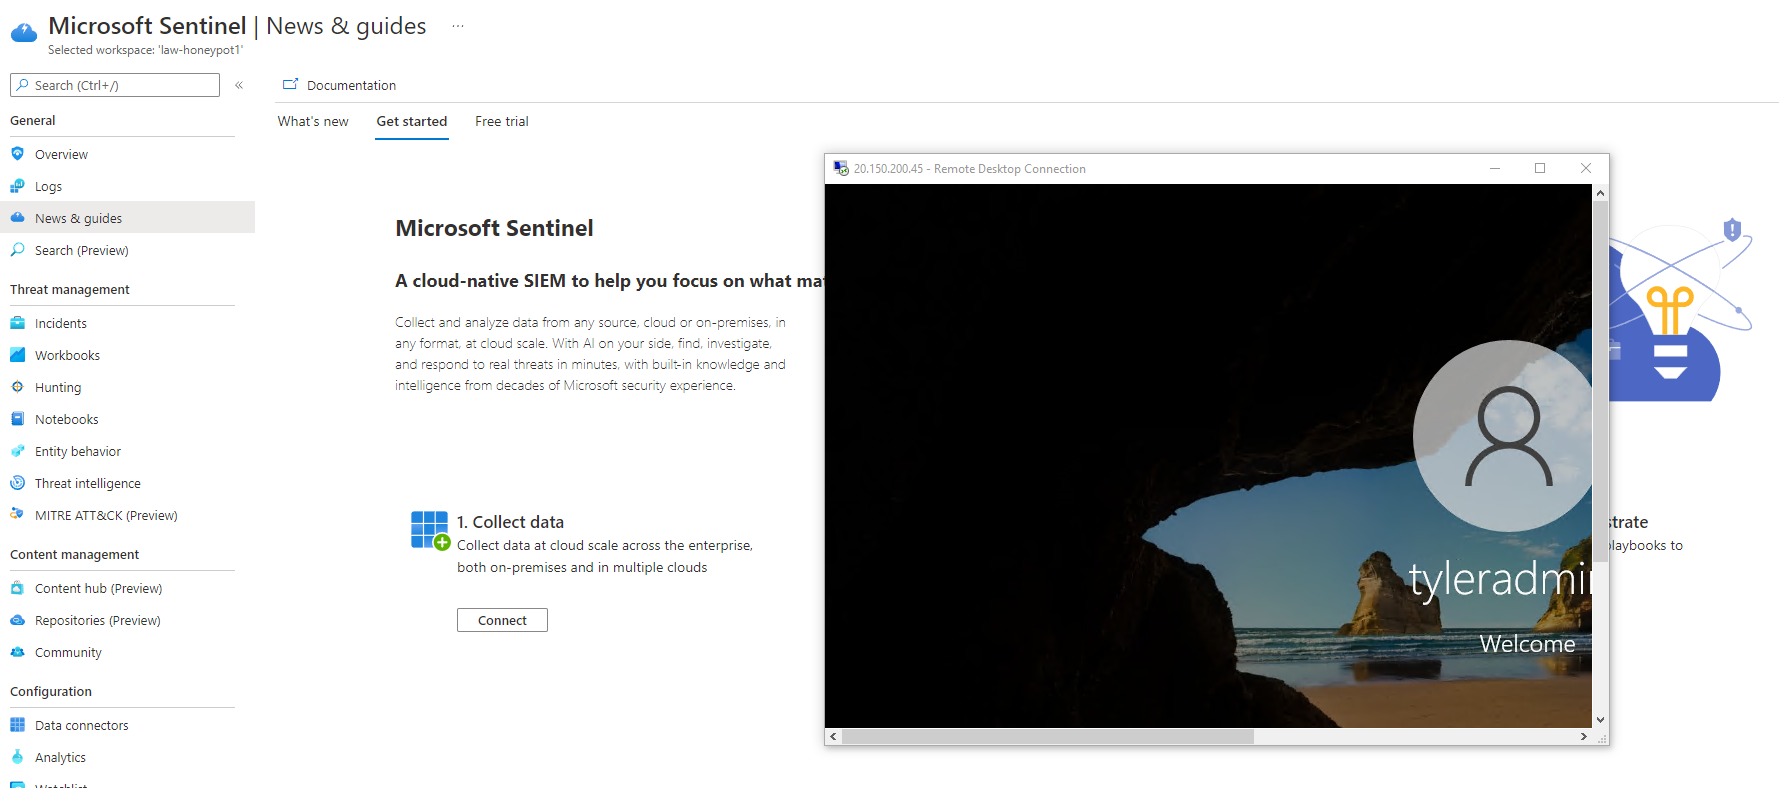
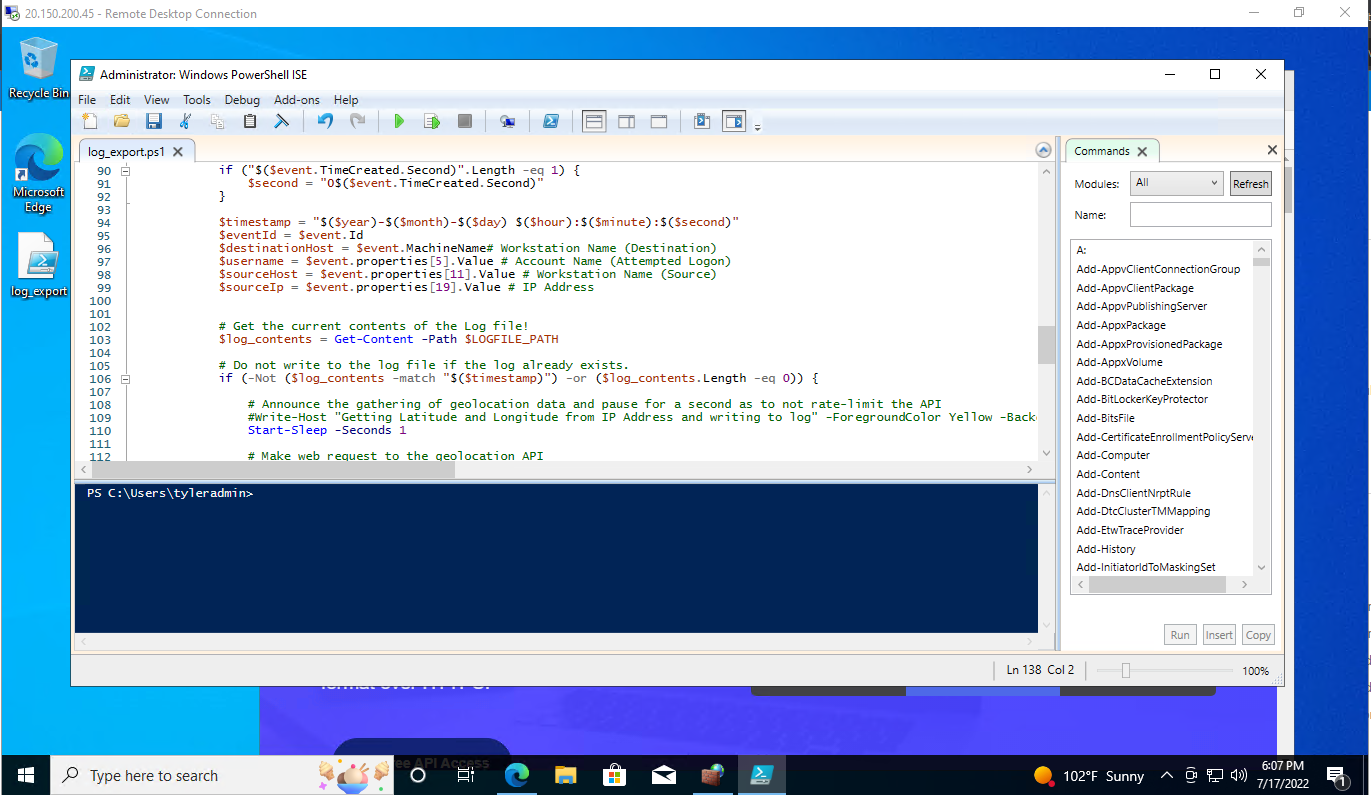
Now I will use Log Analytics work space to ingest the windows event logs from the virtual machine and create a custom log that will contain geo graphic information from the powershell script to discover where the attackers are coming from. The SIEM (Azure Sentinel) will connect to the workspace to display the geo data on a map.
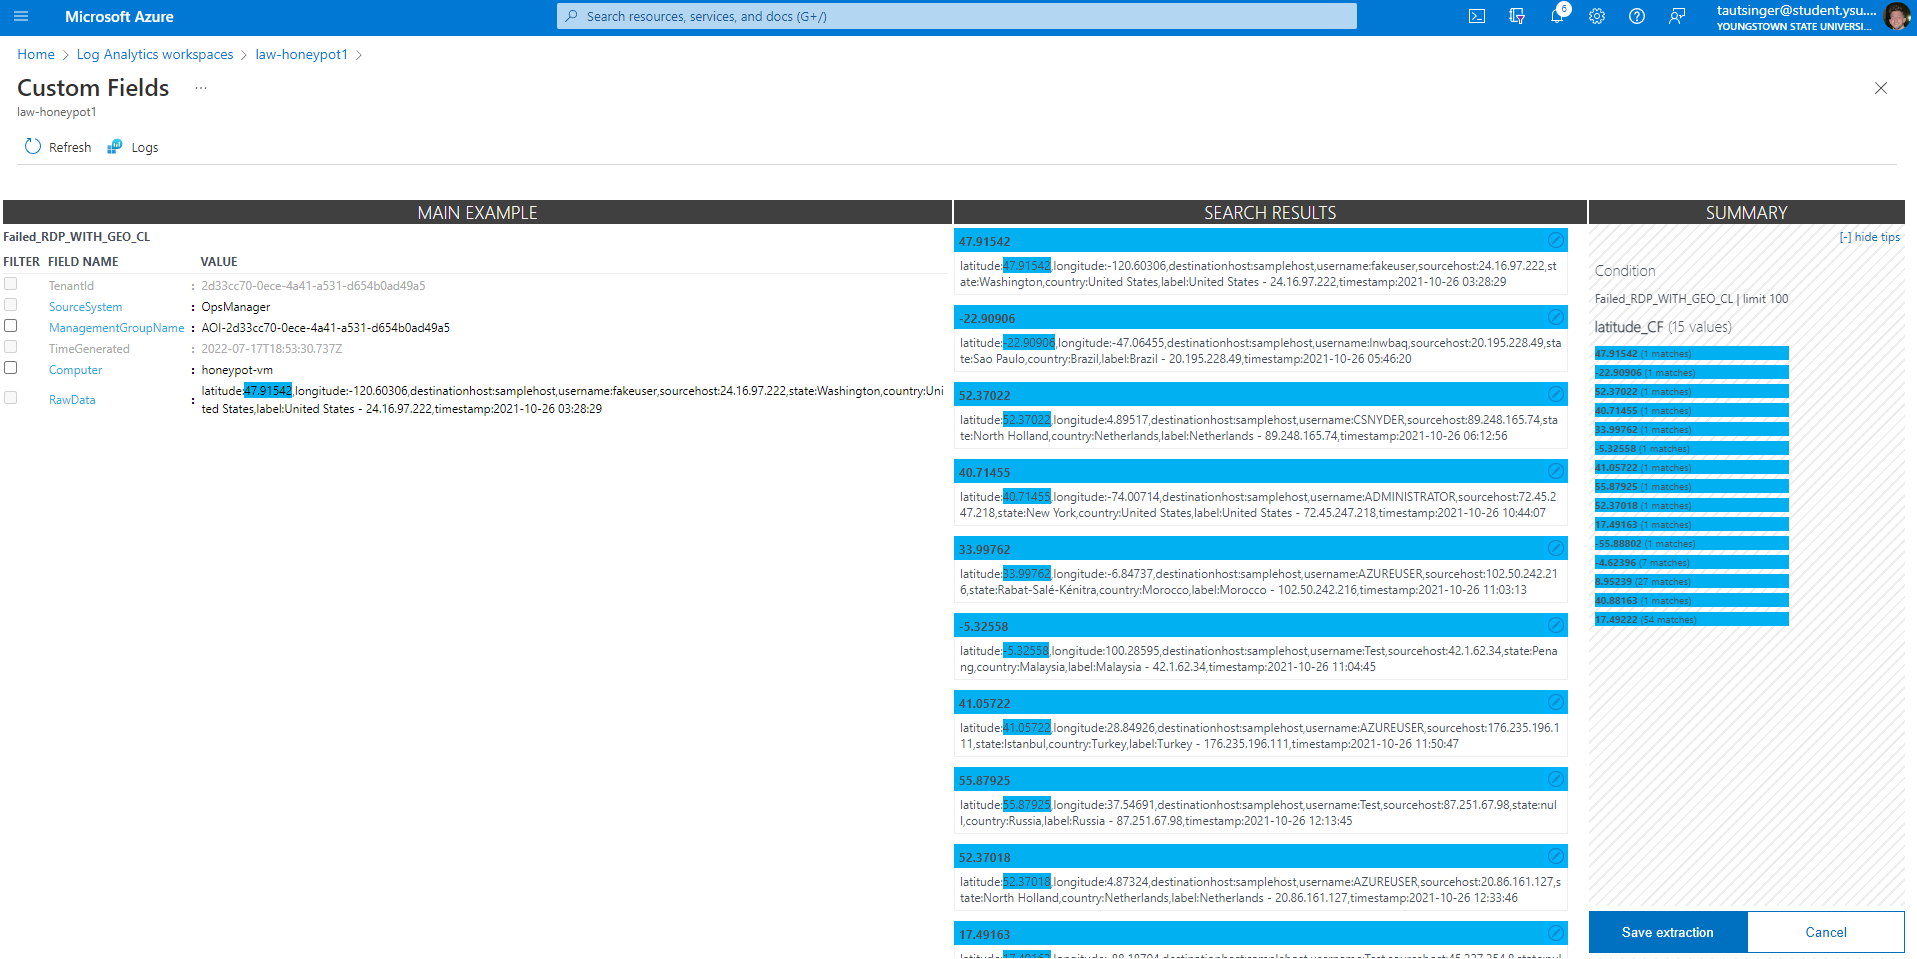
Creating custom fields from the raw data we got from the windows security logs and powershell.
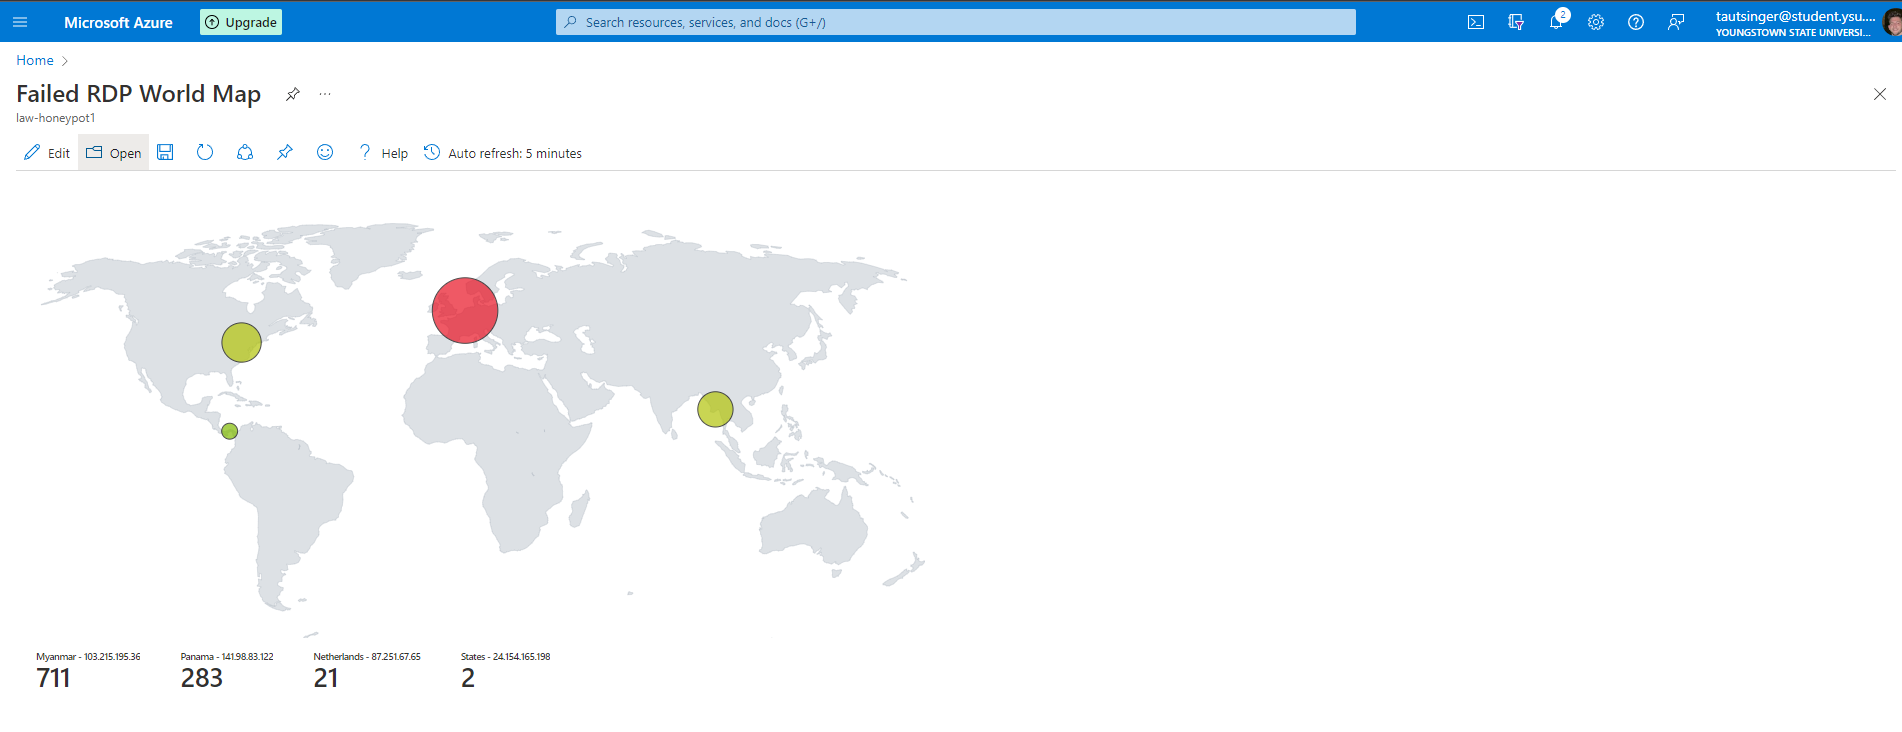
Using the custom fields, I created a map in the SIEM to plot the attacks.
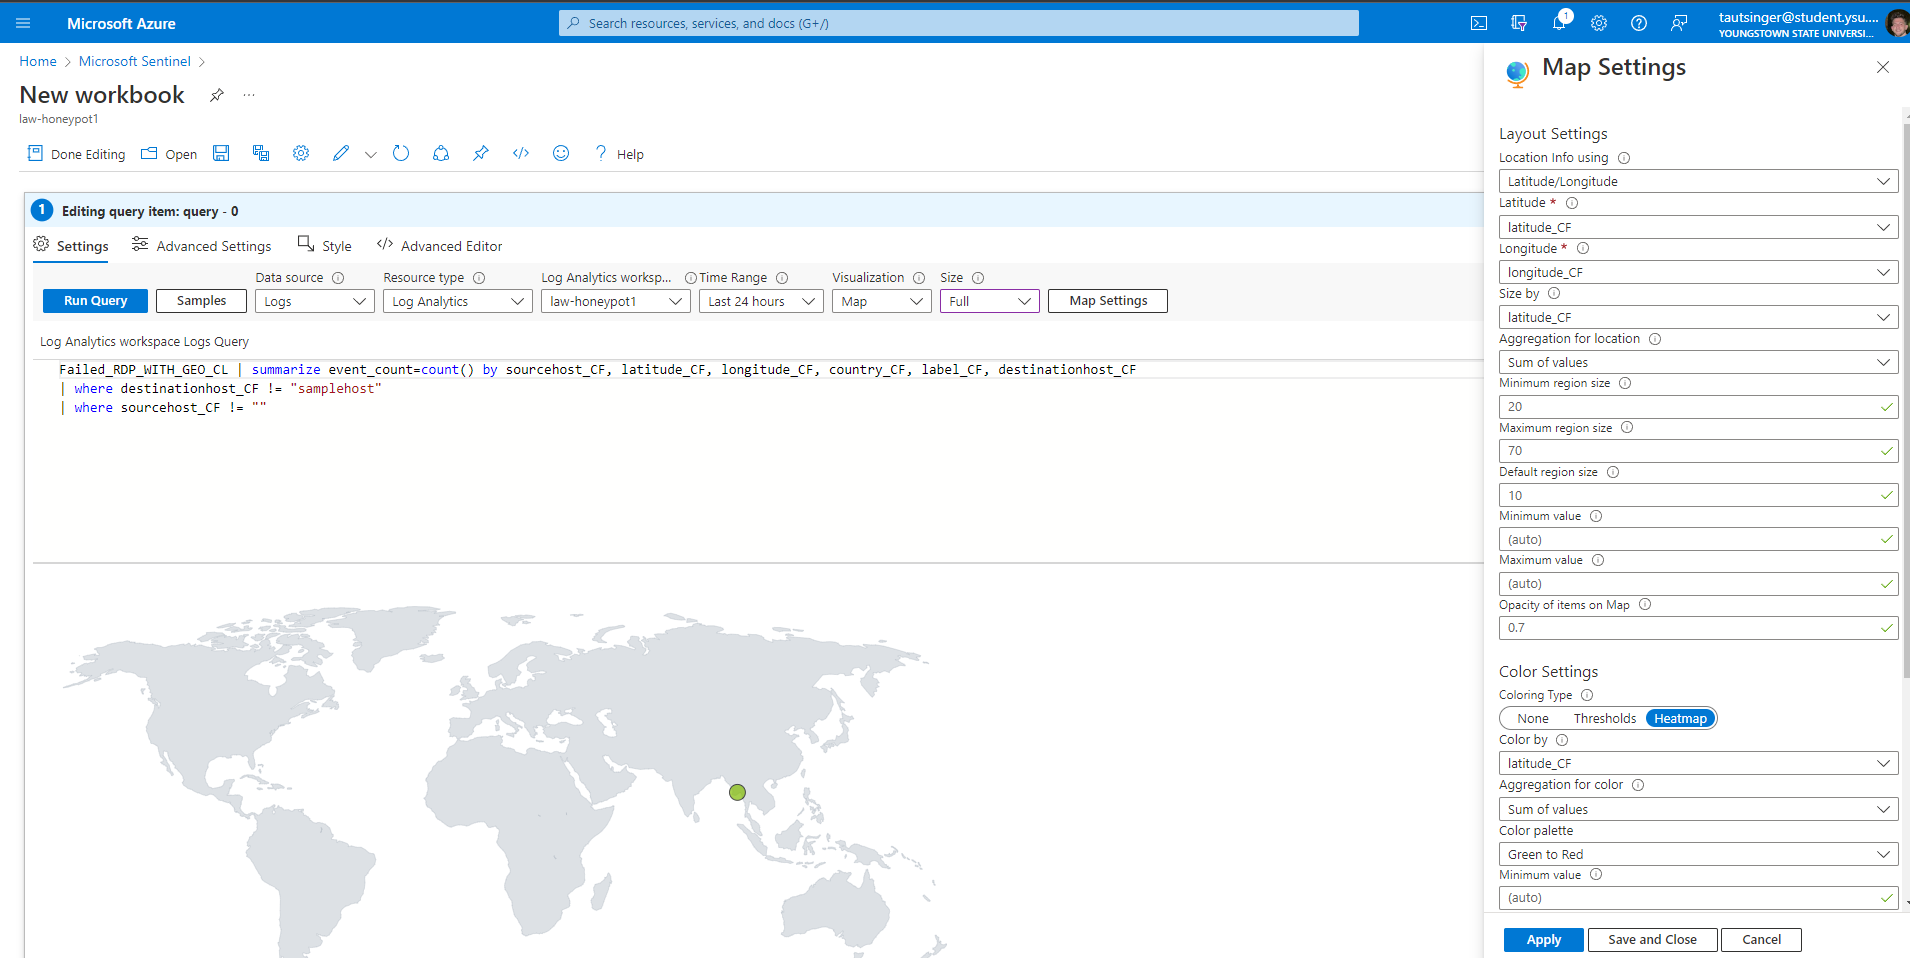
These are live attacks thru failed RDP attempts with the script only running for 10 minutes. The API used to get the GEO data has a limit of 1000 requests so I was only able to plot the first 1000 attempts.
